I don't just ship code.
I carry the weight of what happens after.
I'm Shrikar Kaduluri, DevOps engineer and AI security specialist. My goal is to build resilient systems that don't just stay up, they stay safe. I treat every deployment with the weight of someone who knows that production downtime is a human-impact event.
Flask-K8s-DevOps
A three-act engineering screenplay. The friction, the physics, and the responsibility — for a containerized Flask service running on Kubernetes with a full CI/CD lifecycle, observability, and security baked in.
The original logic flow, sketched before a single line of code was written. Precision starts on paper.
A Flask app, a laptop, and a prayer.
Before any of this, the app lived on a single machine. Deploys were manual. Config drifted. There was no rollback story, no observability, no way to know if the thing was healthy without poking it. The friction wasn't a bug. It was the system. That's the inciting incident: a service that worked, and an operator who couldn't sleep.
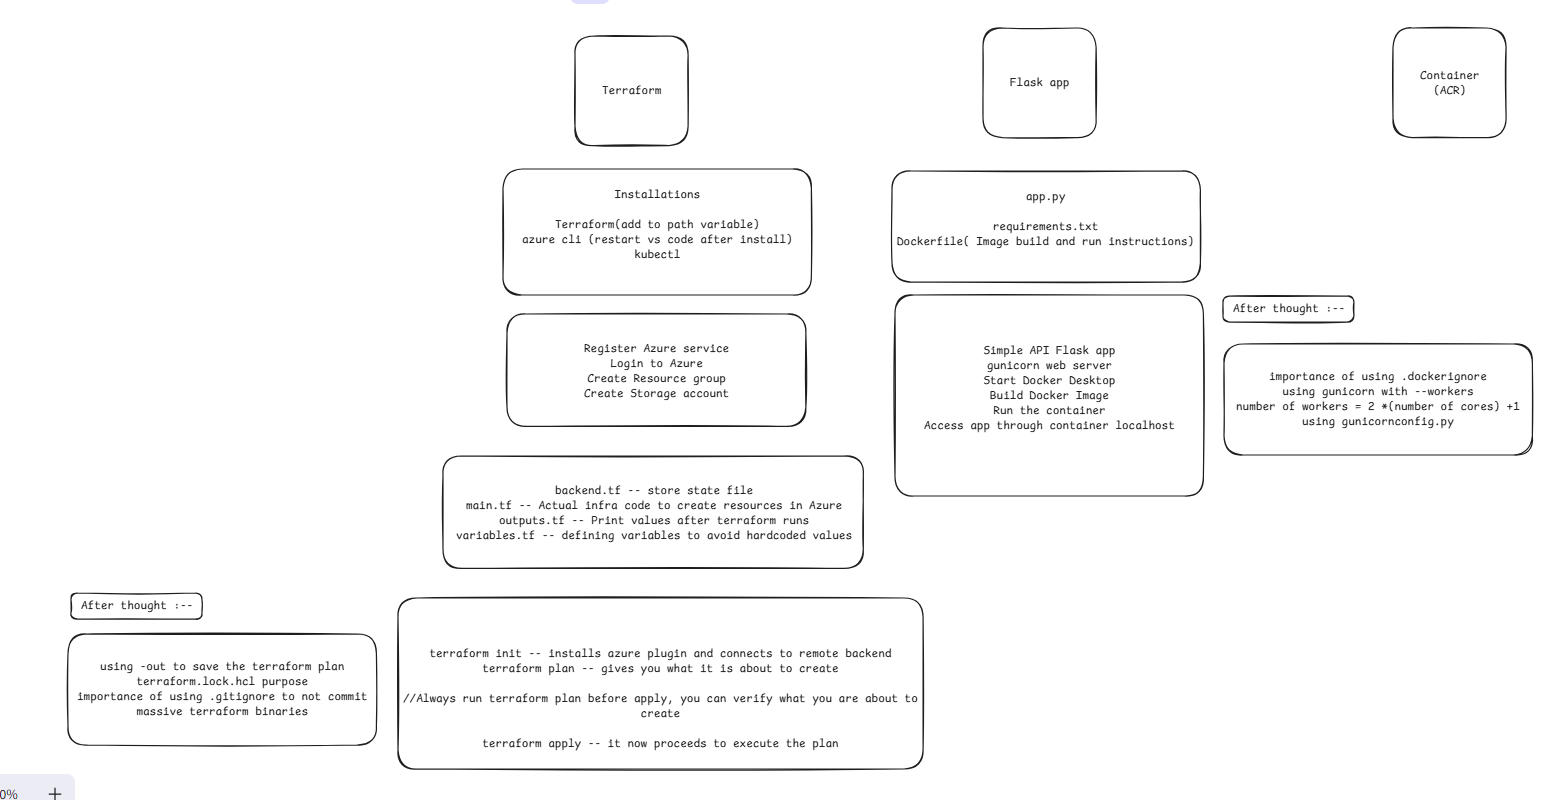
Build the set before you shoot the scene.
Why Terraform? Because clicking buttons in a portal isn't infrastructure, it's a fingerprint. Terraform turns the cluster, the registry, the resource group, and the network into code you can review, diff, and re-create. Why Kubernetes? Because once you have more than one pod, you need a scheduler that understands restarts, health, secrets, and networking as first-class verbs. Why a pipeline? Because the moment a human runs the deploy, the system is one bad day away from outage. These choices aren't trends. They're the load-bearing physics that hold the set together.
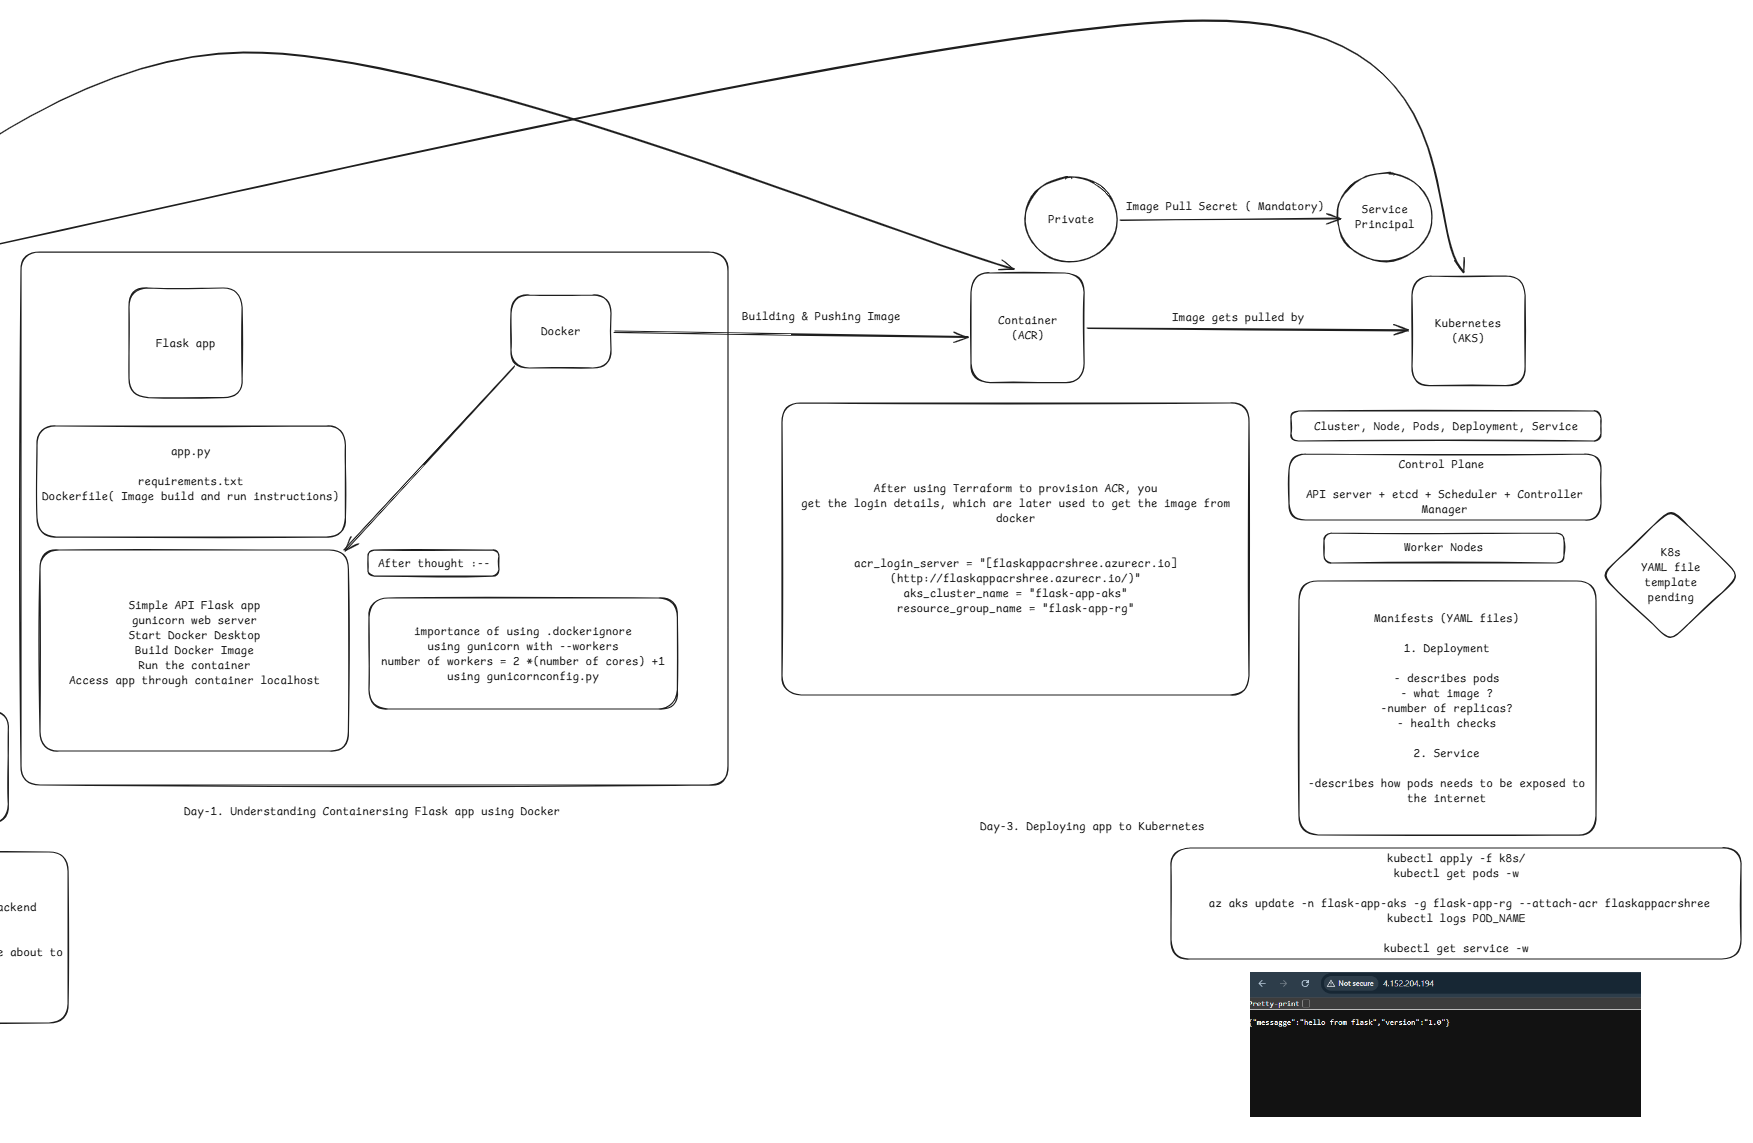
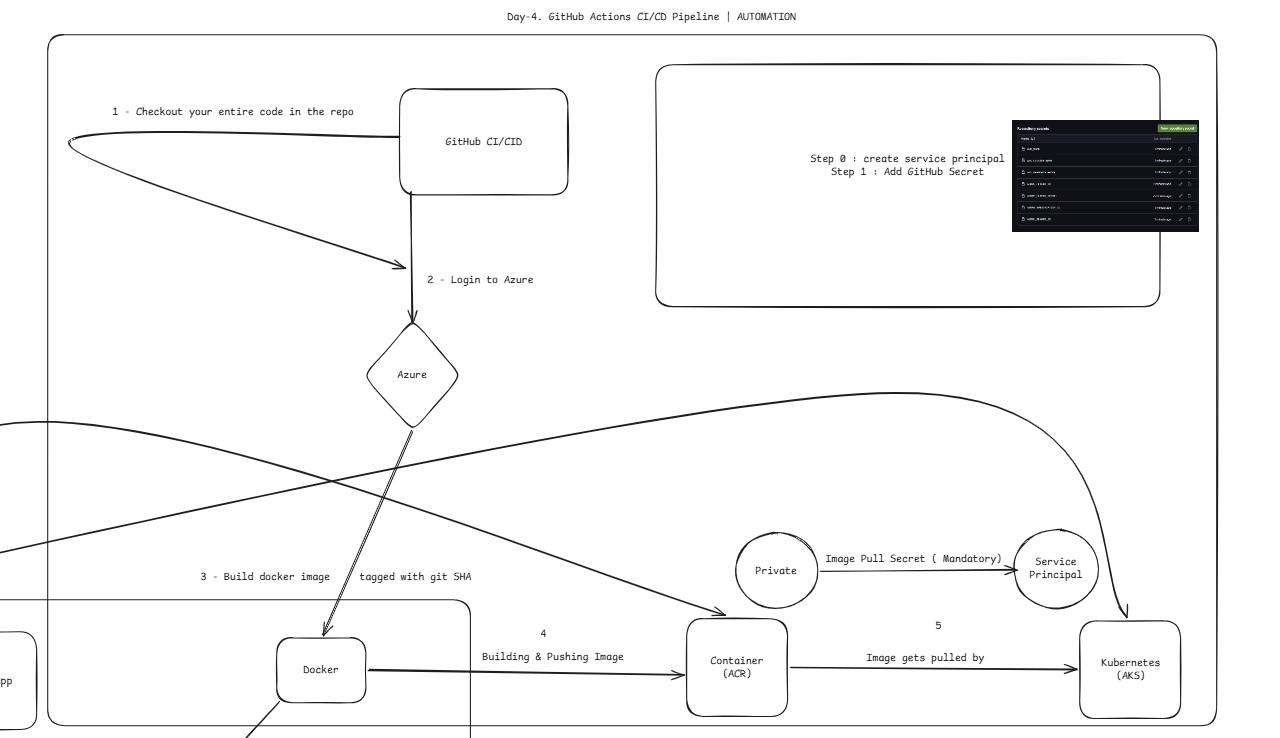
When the system is under load, who's watching?
The script ends where most demos start. Once the system is live, every signal matters. Below is the actual instrumentation: Prometheus scraping the cluster, Grafana telling the truth, and a deployment strategy built to survive bad pushes.
Observability — Prometheus & Grafana
- kube-prometheus-stack installed via Helm into a dedicated monitoring namespace, scraping kubelet and kube-state-metrics across the cluster.
- Grafana dashboards for CPU/memory utilisation and network traffic, per pod and per namespace.
- Port-forwarded Grafana with a decoded admin secret straight from Kubernetes, no plaintext credentials in repos.
- Used pre-built cluster and pod dashboards to see how workloads are distributed across nodes in real time.
Deployment & Resilience
- 2 replicas behind a Service, with liveness and readiness probes hitting /health to catch and restart unhealthy pods automatically.
- Rolling updates on every push: new pods come up healthy before old ones terminate, zero downtime.
- Practiced failure recovery directly: forced a bad deploy, then used kubectl rollout undo to roll back cleanly.
- Scaled replicas up and down manually to validate how the Service load-balances across pods.
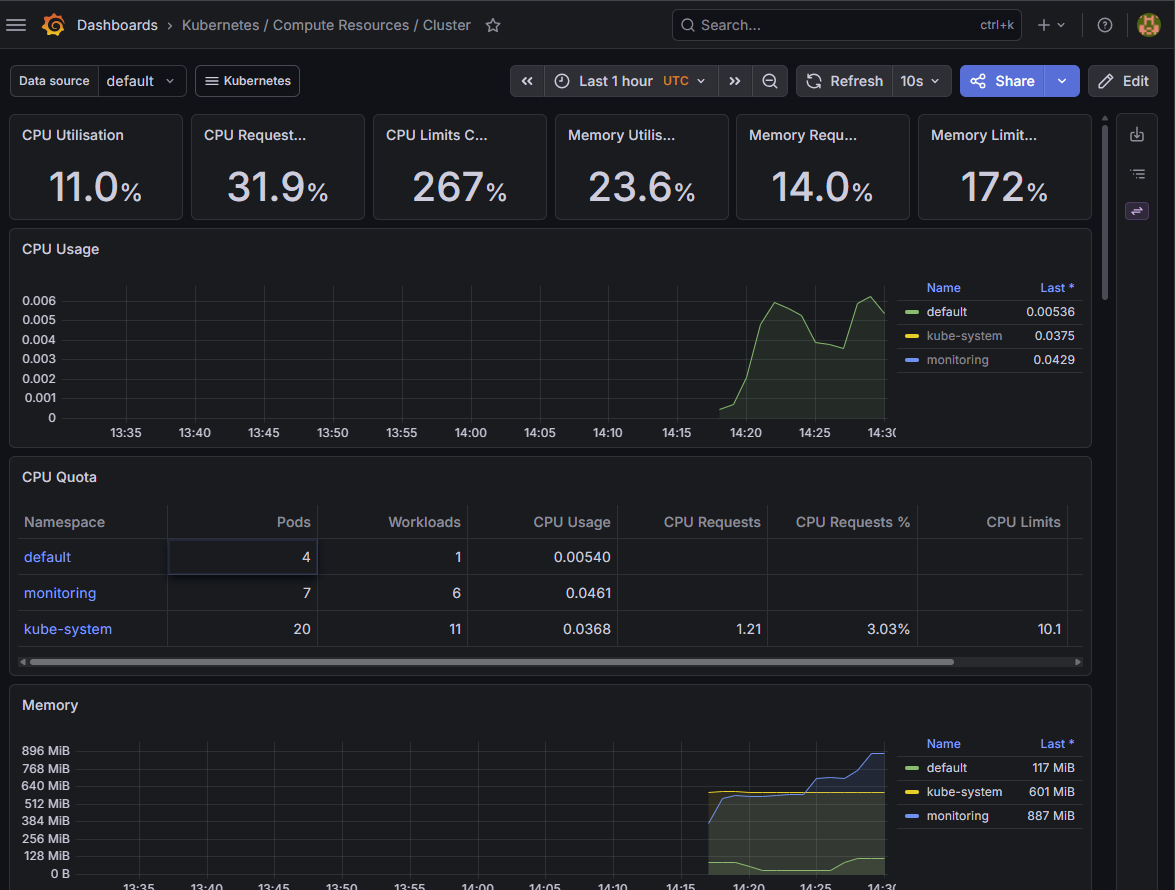
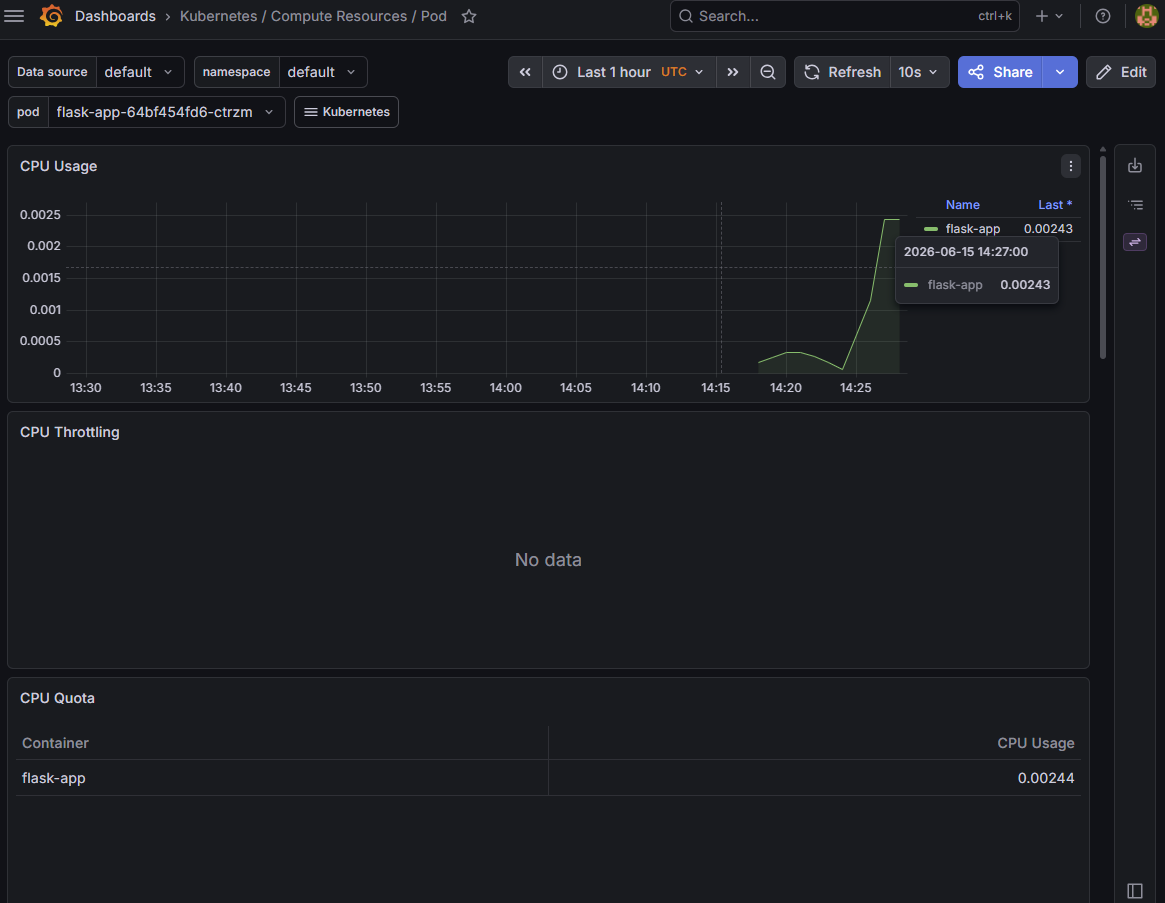
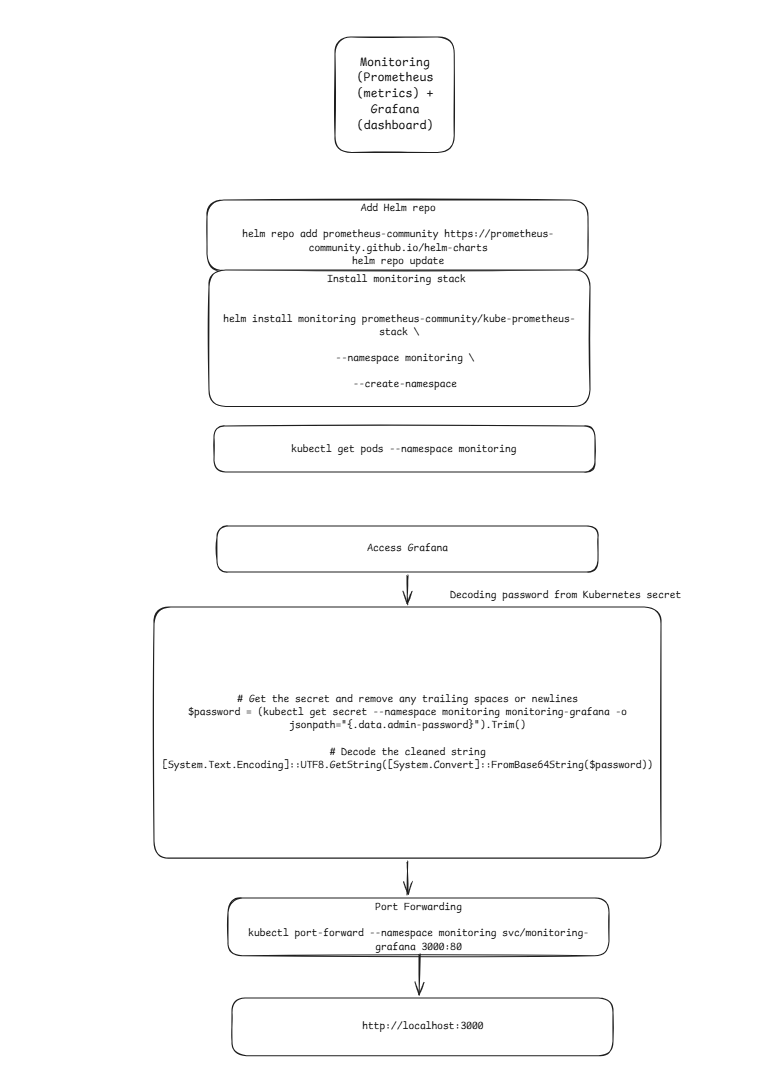
Where the screenplay was rehearsed, in production.
Information Technologist I
@ ODRC- ›Built Python log-collection pipelines with structured ingestion, rotation, and access controls, keeping audit trails tamper-evident across distributed services.
- ›Built PowerShell and Bash health-check scripts for 50+ Polycom RealPresence/RMX MCU endpoints, sustaining a 99.5% uptime SLA for 3,000+ staff.
- ›Cut average ticket resolution time 35% across 300+ ServiceNow tickets/quarter by building a root-cause-analysis knowledge base and streamlining triage.
- ›Diagnosed H.323/SIP and network-layer failures across 5+ sites; automated endpoint log collection with Python to cut manual troubleshooting time.
Prompt Engineering Intern
@ WelSpot- ›Built and containerized a Python Flask chatbot using LangChain and ChromaDB with Docker, ensuring consistent behavior across local and staging environments.
- ›Built a GPT-3.5-based evaluation pipeline that regression-tested chatbot accuracy against 20+ expected outputs on every model/prompt change.
- ›Integrated Graphsignal to trace latency and token usage in production, turning AI reliability into a measurable metric instead of a guess.
System Engineer
@ Infosys · Hyderabad, India- ›Wrote Python monitoring/alerting scripts for Informatica PowerCenter and Control-M ETL jobs across 5 environments.
- ›Built Grafana/Prometheus dashboards tracking application health during load tests, feeding directly into VP-level reliability reviews.
- ›Ran performance test cycles on 3+ enterprise applications using HP ALM and LoadRunner, identifying and resolving bottlenecks before production release.
Three stacks. One mission: keep intelligent systems online and trustworthy.
Cloud & DevOps
Designing, deploying, and operating cloud-native systems.
Observability & Security
Knowing what the system is doing, and keeping it honest.
AI Engineering
Building and evaluating LLM-powered systems.
Verified Azure foundations.
Independent validation of the cloud security and operations knowledge that underpins every system I build.
Microsoft Azure Administrator
Identity, governance, storage, compute, and virtual networking on Azure: operating the cloud responsibly.
Microsoft Azure Fundamentals
Core Azure services, security, compliance, and the shared-responsibility model.